Three speed readings, three different questions
| Reading | What it measures | What it does not prove |
|---|
| Negotiated Ethernet link speed | The immediate port-to-port rate between the computer or adapter and its connected network device. | It is not your internet plan throughput. |
| Local file transfer speed | LAN application performance, including storage, protocol overhead and drive bottlenecks. | A slow disk or remote computer can limit copying even with a gigabit link. |
| Online speed test | Throughput over the end-to-end internet path to the test server. | It does not isolate which cable, port or other part of the path failed. |
A 100 Mbps negotiated link caps throughput on that hop; useful application throughput will be lower after overhead. A 1.0 Gbps reading confirms a gigabit local link, but never promises exactly 1000 Mbps internet. Keep the link reading and online test result in separate columns.
Step 1: Read the actual negotiated link speed
In Windows 11, open Settings > Network & Internet > Ethernet and look for Link speed, sometimes labeled Link speed (Receive/Transmit). The adapter's Status window is another route: open Control Panel > Network and Internet > Network and Sharing Center, select the Ethernet connection, and read Speed. Confirm you are inspecting the wired adapter rather than Wi-Fi or a VPN.
On macOS, open System Settings > Network > Ethernet, choose the connection's details and inspect the hardware details for the negotiated speed. The names and available controls vary by Mac model, adapter and macOS release; consult the exact hardware documentation if the rate is not shown. Record the original value before changing anything. Note whether it says 100 Mbps, 1000 Mbps or 1.0 Gbps, or whether there is no link at all.
Step 2: Bypass the original cable path
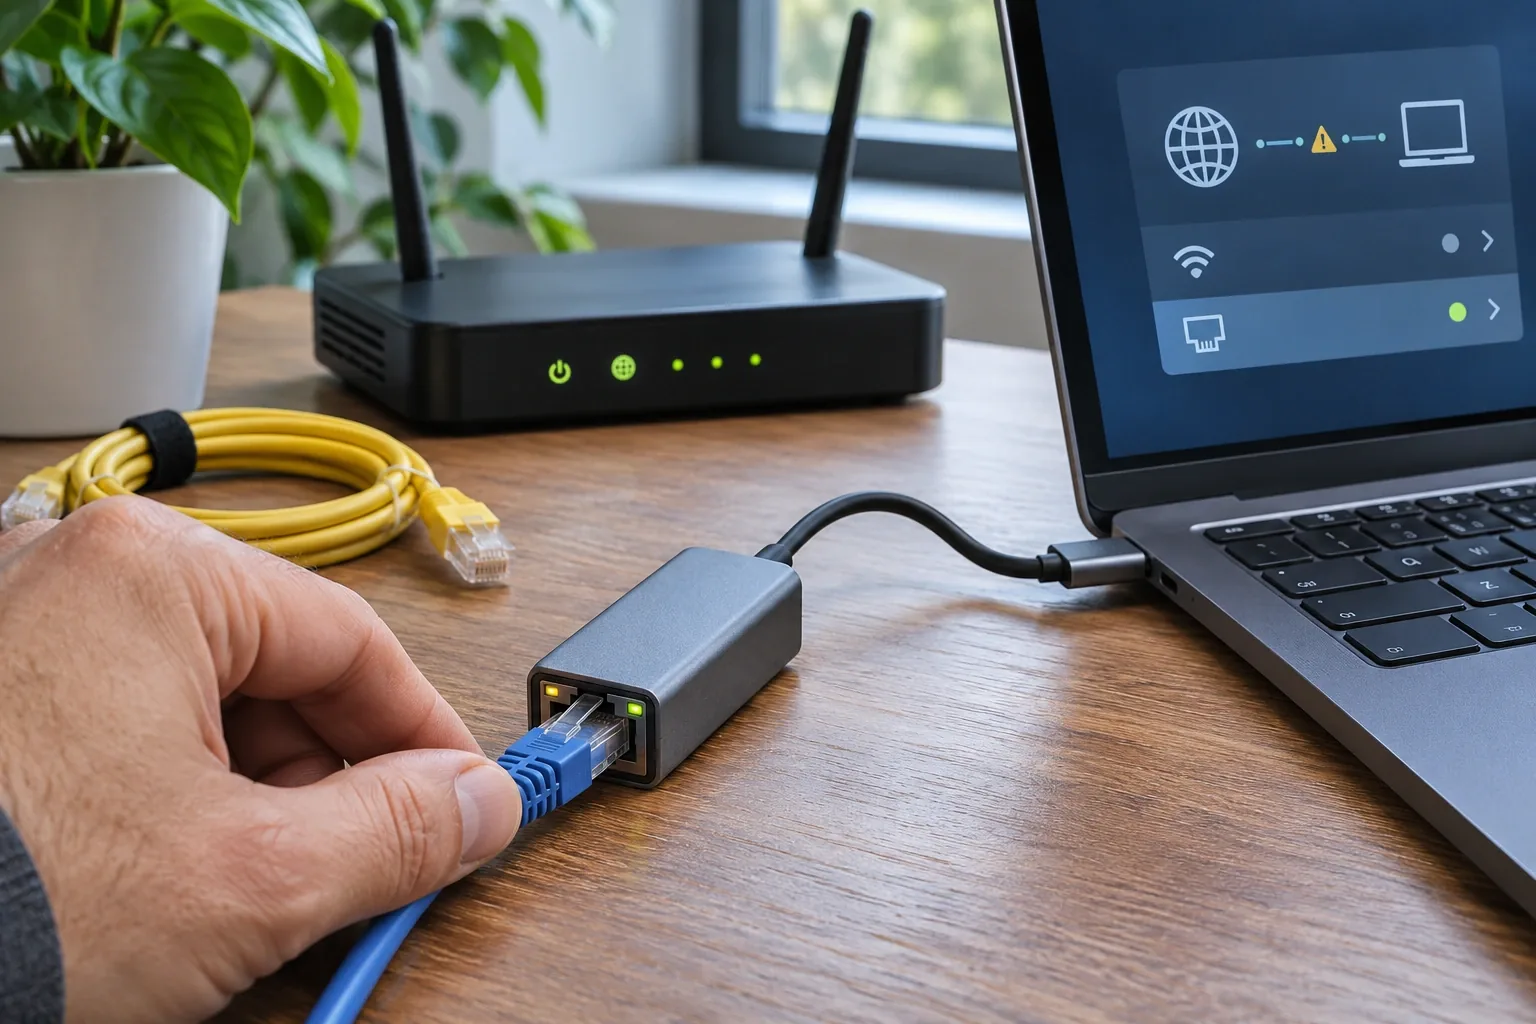
Use a short, factory-terminated, known-good Cat5e or Cat6 lead directly from the computer or USB Ethernet adapter to a verified gigabit router or switch port. Known-good means it has already negotiated a gigabit link in a working setup, not simply that it is new or has a Cat6 label. Verify the port's capability in the exact model's specifications or with another working gigabit device.
For a desk-side test, CableWholesale’s 7-foot Cat6 copper patch cable (10X8-06107) can reach from a laptop to a nearby switch. First check that the cable negotiates 1 Gbps on a working setup. Then use that same cable to test the port where you saw 100 Mbps.
View the 7-foot Cat6 cable in the catalog
Bypass wall plates, couplers, patch panels and intermediary switches for this comparison. Write down the computer and adapter model, the device model and port number, and the complete original cable route. Re-read the negotiated link after the connection settles. Change only one variable in each follow-up test, keeping the working reference cable and equipment consistent.
| Result | Likely direction | Next action |
|---|
| Short direct cable negotiates 1 Gbps | The original physical path is suspect. | Reintroduce one cable, wall jack, coupler or switch at a time to find where the rate drops. |
| Short direct cable remains at 100 Mbps | Hardware capability, port configuration, the test cable or the driver still needs checking. | Reverify the cable and port with another gigabit device, then inspect the original adapter. |
| Alternate switch port negotiates 1 Gbps | The original port may be 10/100-only, configured to 100 Mbps or faulty. | Read the exact port specification and have the administrator check its settings. |
| All tested ports negotiate 1 Gbps but internet is slow | The local link rate is no longer the same bottleneck. | Diagnose WAN/ISP service, router load and VPN performance separately. |
Why one damaged pair can matter
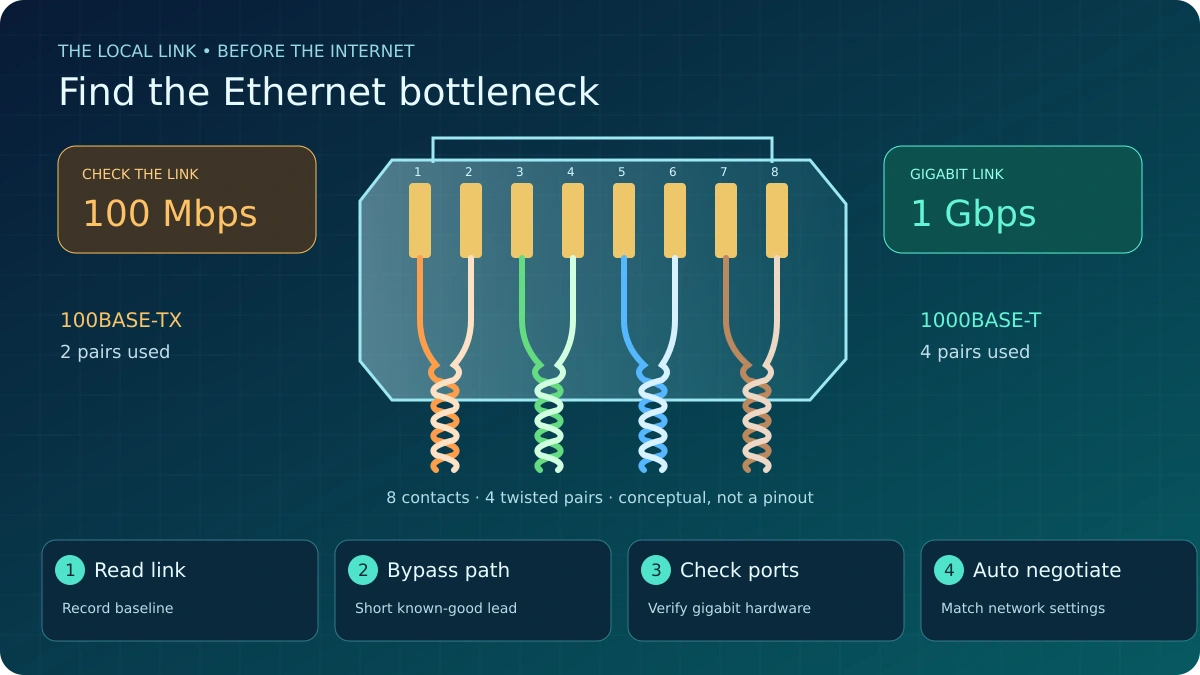
100BASE-TX uses two twisted pairs; 1000BASE-T uses all four pairs. A damaged or incorrectly terminated pair can therefore allow a 100 Mbps fallback, or cause no link at all. A speed reading is a clue, not a cable certification. The transparent eight-contact RJ45-style plug in the illustration is conceptual; it is not a termination diagram.
Do not assume Cat5e is unsuitable: correctly installed Cat5e supports gigabit Ethernet. Check removable leads for bent contacts, broken latches, sharp kinks and crushed sections, and substitute a proven lead before buying a router. For wall jacks, patch panels and permanently installed cable, have a trained installer inspect terminations and test all four pairs and the installed link. Do not pull apart managed or permanent wiring simply because the jacket carries the right category marking.
Step 3: Audit every port, switch and USB-C adapter
The slowest link in the route matters. An older 10/100-only switch, a Fast Ethernet LAN port, or a 100 Mbps USB-C Ethernet adapter cannot negotiate gigabit just because the main router can. Check each exact model and each port: an uplink's advertised speed does not establish the capability of every access port. Cisco's Catalyst 1000 documentation, for example, distinguishes Fast Ethernet and Gigabit Ethernet models and their uplinks.
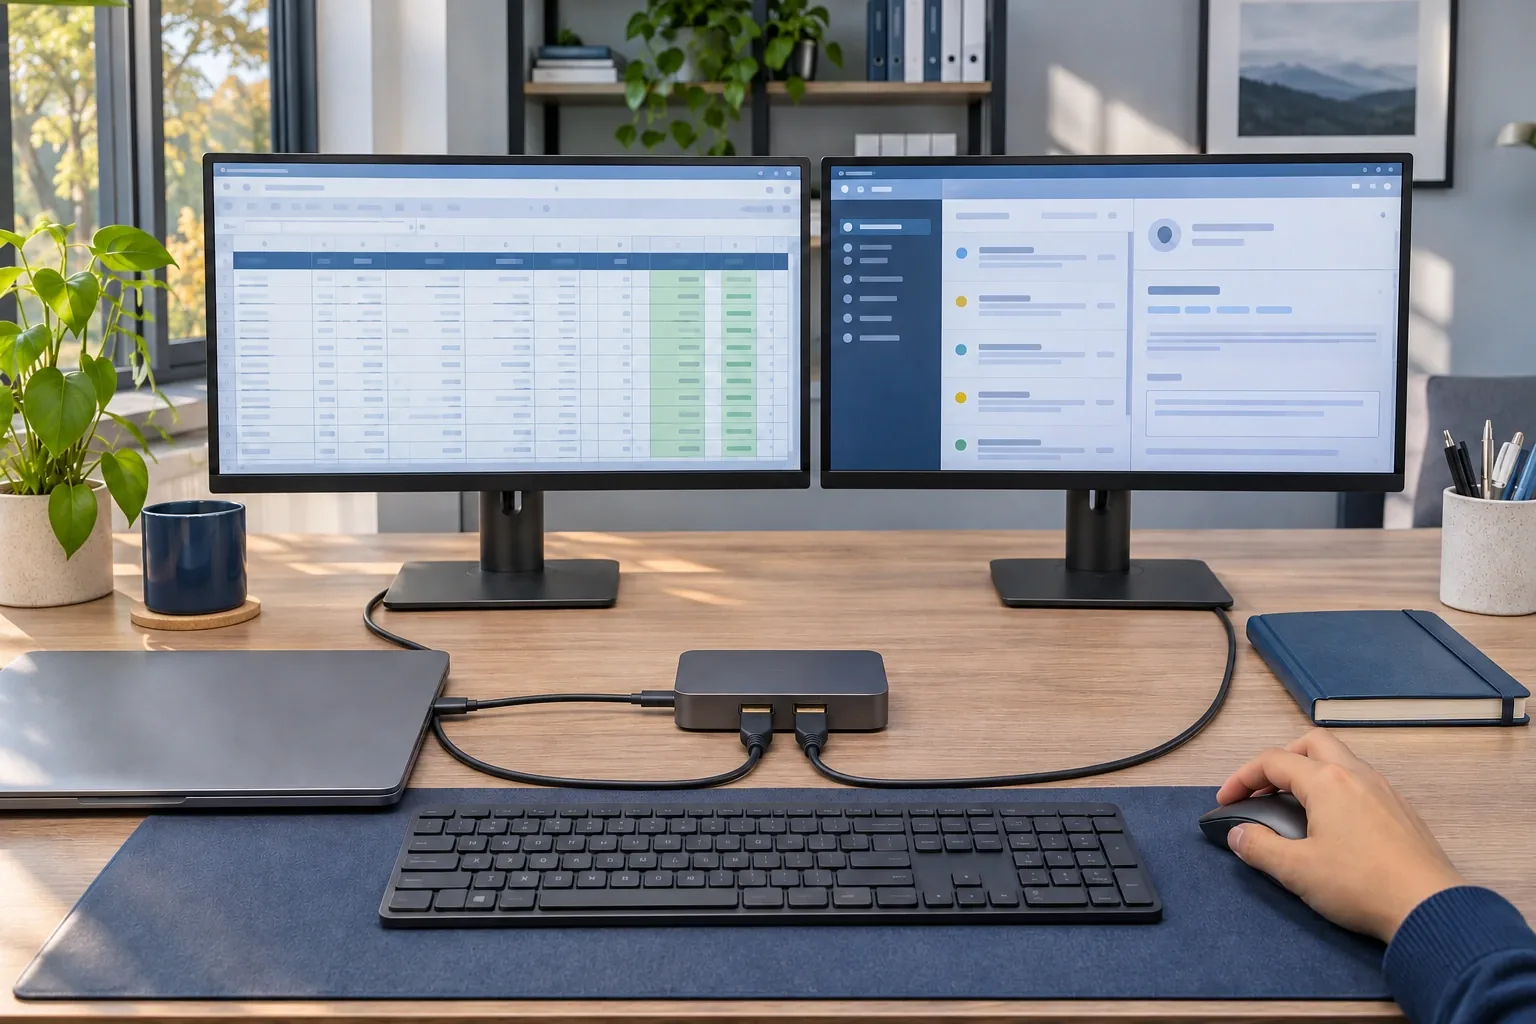
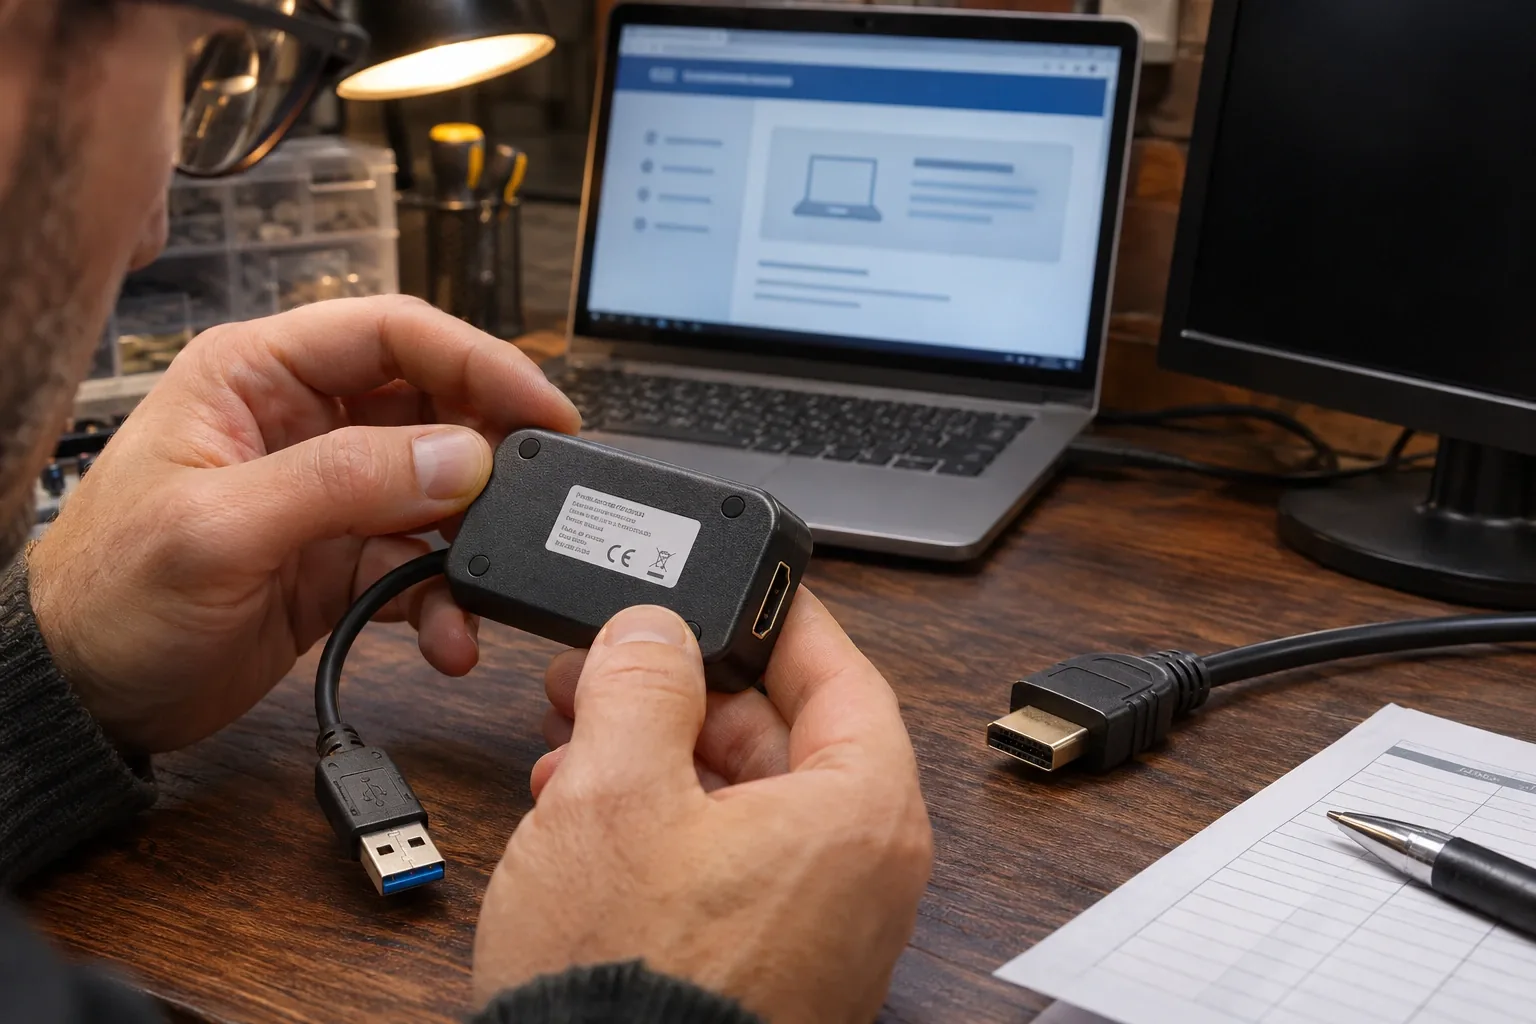
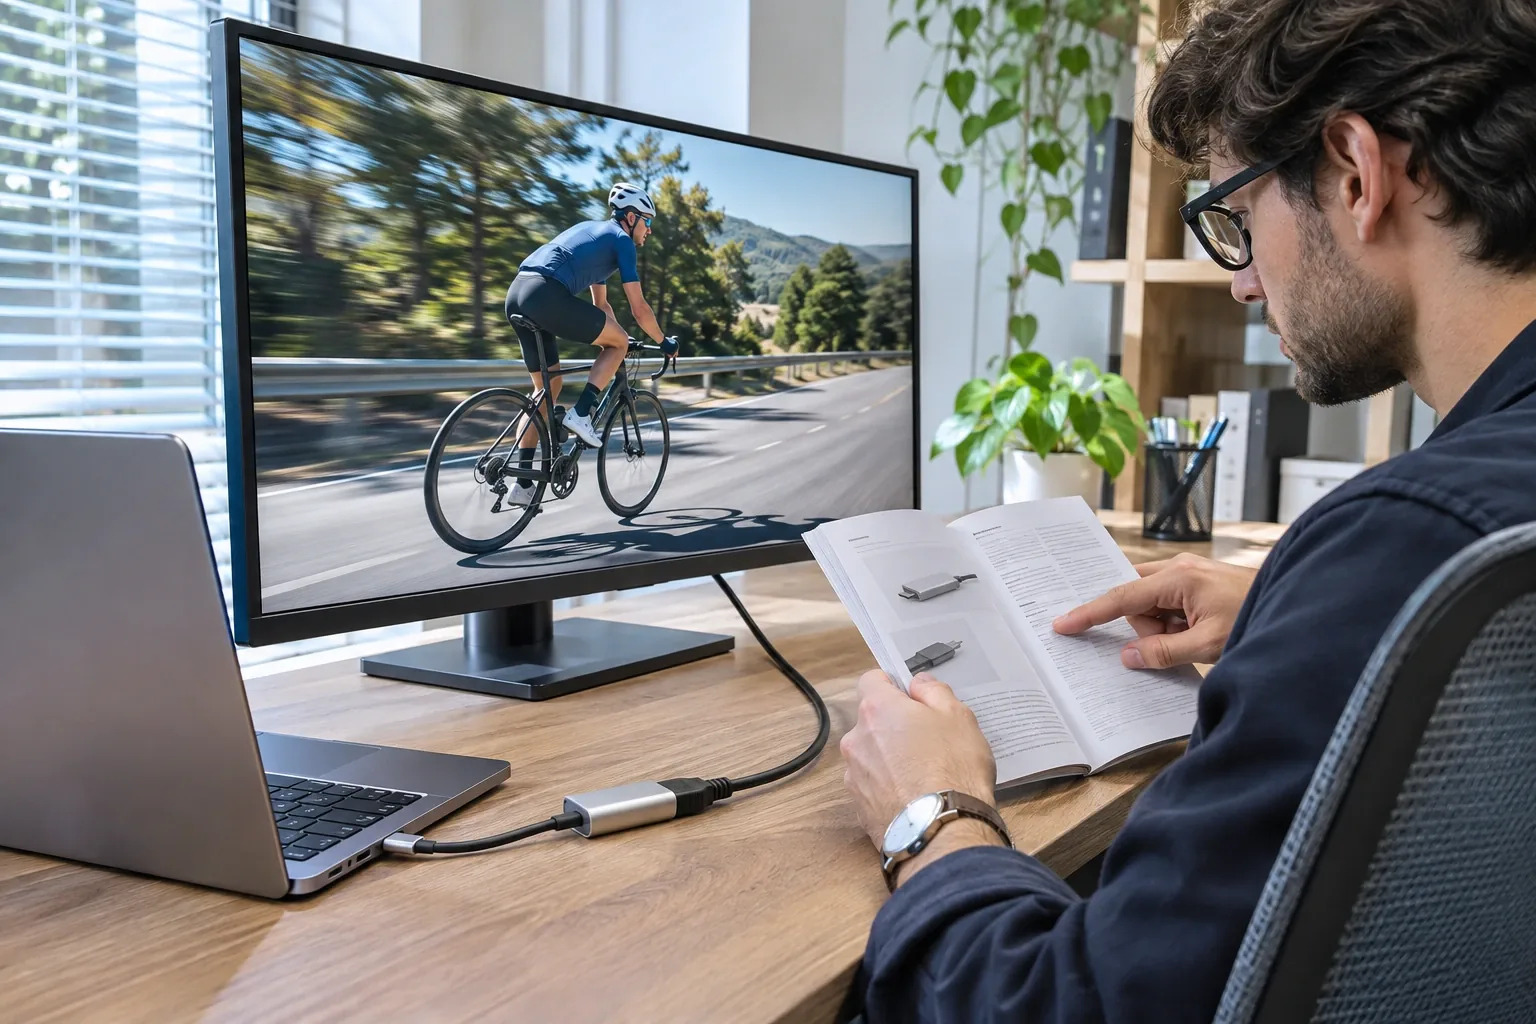
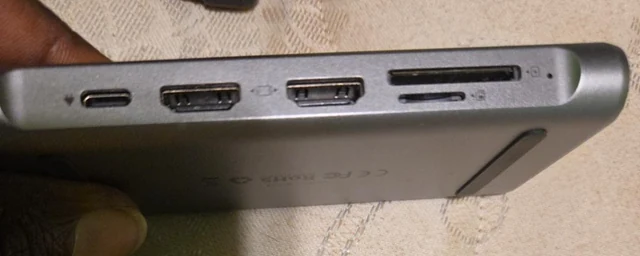
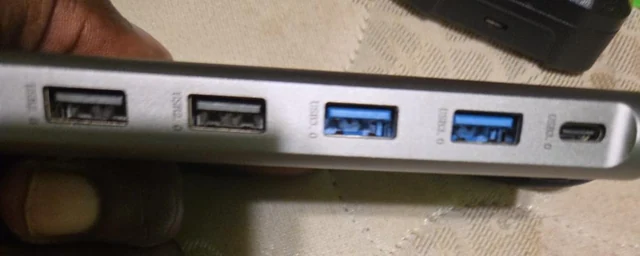
For a USB-C adapter, confirm the Ethernet specification, host compatibility and manufacturer-supported driver. USB-C describes the connector; it does not guarantee a gigabit Ethernet chipset. Prefer the computer or adapter manufacturer's correct driver for that exact hardware and OS. Test the adapter on another known-working gigabit setup if available. If the adapter is not detected at all, follow the USB-C Ethernet adapter not working guide first; that is a different branch from a detected adapter negotiating at 100 Mbps.
Step 4: Keep Auto Negotiation and check managed settings
Intel recommends Auto Negotiation for gigabit operation. On supported Windows adapters, the setting is under Device Manager > Network adapters > the adapter's Properties > Advanced > Speed & Duplex. A missing manual “1.0 Gbps Full Duplex” choice is not itself evidence of a broken adapter. With compatible equipment and sound cabling, Auto Negotiation can establish the gigabit rate.
Do not casually force duplex or speed. Manually forcing duplex without matching the switch side can create a duplex mismatch and severe performance degradation. On an IT-managed network, ask the administrator to review both ends; do not override policy, change switch settings or disable protections to chase a higher number. If Auto Negotiation is already selected, return to the controlled cable, port and adapter tests.
Still slow with a negotiated 1 Gbps link?
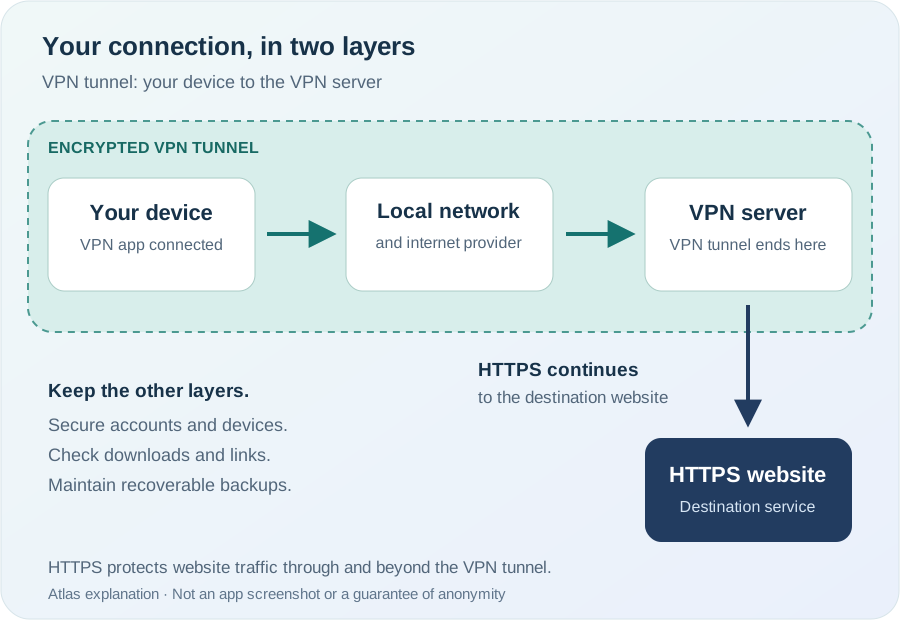
Now check your ISP plan and the WAN side separately. Record an online test with the server, date and time, then compare another time or day. Review router load, backups and uploads, and other concurrent traffic. If your organization permits it, compare an approved test with and without the VPN; do not bypass a required work VPN. A slow WAN port, busy router or remote test path can limit throughput despite a healthy local gigabit link.
If the local link is fixed and your business needs a service review, explore Spectrum Business Internet. Spectrum availability is address-specific and provider eligibility and marketing approvals apply. This guide makes no price or speed guarantee and does not establish that a service upgrade will fix your equipment.
Diagnostic worksheet
Copy or print this table. Keep the original reading so each test has a useful comparison.
| Record | Your result |
|---|
| Computer + adapter model | |
| Original link reading | |
| Router + port | |
| Original physical path | |
| Short-cable result | |
| Alternate port/device result | |
| WAN throughput result (only after link fixed) | |
Frequently asked questions
Does Cat5e support gigabit?
Yes, correctly installed Cat5e supports 1 Gbps (1000BASE-T). 100BASE-TX only uses two pairs, but Cat5e is rated for all four at gigabit speeds.
Why does Windows show 100 Mbps even with a 500 Mbps plan?
The ISP plan speed is irrelevant to the local Ethernet link speed. A 100 Mbps negotiated link caps the hop between computer and router, regardless of your internet plan.
Should I force 1.0 Gbps full duplex on the adapter?
No. Intel recommends Auto Negotiation. Manually forcing duplex without matching the switch side causes duplex mismatch and severe performance degradation.
Does a 1 Gbps negotiated link guarantee 1000 Mbps online?
No. A 1 Gbps link is the local hop rate. Actual internet speed depends on ISP plan, router load, VPN usage, and the end-to-end path quality.
Sources
This is an editorial guide based on official documentation, not a bench-tested equipment review. The illustration and troubleshooting sequence do not claim actual speed benchmarks or endorsement by Intel, Cisco, Apple, Microsoft or a service partner.
More help: USB-C Ethernet troubleshooting · Atlas resources.
Atlas may receive compensation from qualifying purchases or service referrals. No unverified affiliate tracking links are included in this guide.